The Evolution of Debugging in React Native
As React Native continues to evolve, the tools and workflows developers use to debug and optimize their apps must also adapt. With the release of the new React Native architecture (including Fabric and TurboModules), debugging has become more complex but also more powerful, with the addition of new features and tools.
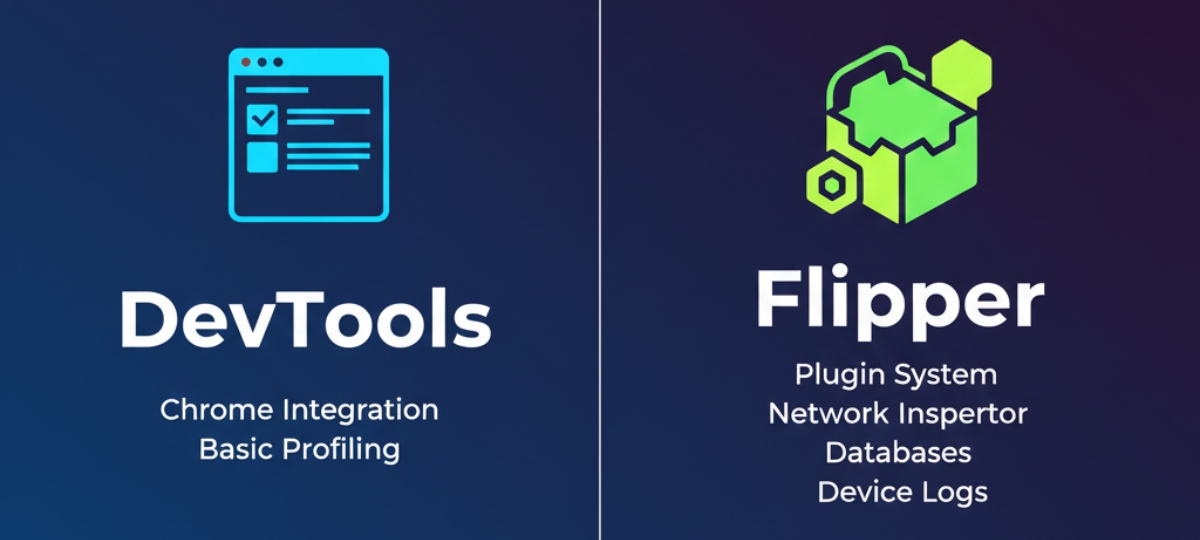
Two major debugging tools that play a key role in this evolution are React Native DevTools and Flipper. Both tools serve distinct purposes in the debugging workflow, offering developers unique insights into their apps, but which one should you use, and when? How do they work with the new architecture?
In this article, we’ll compare React Native DevTools and Flipper, exploring their strengths, weaknesses, and the best ways to integrate them into your React Native development workflow for versions 0.81 and beyond—helping teams delivering React native development services build more efficient, debuggable, and scalable mobile applications.
What Is React Native DevTools?
React Native DevTools is a toolset that enables developers to inspect and debug React Native applications, facilitating tasks such as inspecting component hierarchies, managing state, and identifying performance bottlenecks. It’s built directly into React Native, offering deep integration with the React Native development ecosystem.
Key Features:
- Component Inspection: View and interact with the component hierarchy, props, and state in real-time.
- State Management: Examine Redux or Context API stores to inspect application state at any given time.
- Performance Profiling: Offers basic performance profiling features to track frame rates and resource consumption.
- Console Logging: Enables easier access to console logs from the React Native JS thread.
- React Profiler Integration: In React Native 0.81+, DevTools integrates well with React’s Profiler API, offering developers insights into render times and component re-renders.
Pros of React Native DevTools:
- Deep React Integration: Built specifically for debugging React components and state management, providing deep insights into your app’s architecture.
- Lightweight: Since it’s bundled with React Native, there’s no need to install additional software.
- Easy to Set Up: Setup is generally straightforward with minimal configuration required.
Cons of React Native DevTools:
- Limited Native Debugging: Focuses mainly on the JavaScript side of your app. It doesn’t offer as much visibility into native module performance or logs.
Less Feature-Rich for Native Modules: React Native DevTools doesn’t offer advanced capabilities for debugging native code, which is where Flipper shines.
Level Up Your React Native Debugging Workflow
Discover how React Native DevTools and Flipper compare in the new architecture—and choose the right setup for faster, cleaner debugging.
What Is Flipper?
Flipper is a platform for debugging mobile apps that integrates with both iOS and Android. It provides a rich set of features for inspecting both the JavaScript and native sides of your app. With Flipper, developers can interact with network requests, view logs, perform native-level inspections, and more.
Flipper provides a robust debugging experience across both React Native Apps and native mobile code. Since Flipper can work with native iOS and Android apps, it’s particularly useful for developers working with native modules or complex interactions between JavaScript and native code.
Key Features:
- Native Debugging: Offers tools to inspect logs, memory usage, and network requests at the native level (for both iOS and Android).
- React DevTools Integration: Includes a version of React DevTools, enabling you to inspect and profile your React Native components.
- Performance Monitoring: Real-time monitoring of CPU, memory usage, and frame rates.
- Network Inspector: Inspect HTTP requests, WebSocket traffic, and more.
- Custom Plugins: Flipper supports a wide range of plugins, including ones specifically tailored for React Native, such as Redux Debugger, Crashlytics, and SQLite Viewer.
Pros of Flipper:
- Comprehensive Debugging: Provides an all-in-one debugging solution for both JavaScript and native code.
- Advanced Native Debugging: It offers native module debugging, memory management, network inspection, and more.
- Plugin Ecosystem: Flipper’s plugin ecosystem allows developers to customize their debugging environment according to the project’s needs.
- UI Inspector: Interact with UI elements, inspect layouts, and measure performance metrics directly within the app.
Cons of Flipper:
- Setup Complexity: Flipper can be more difficult to set up compared to React Native DevTools, as it requires installation of the Flipper desktop app and setting up specific dependencies.
- Overhead: Flipper’s rich feature set can introduce some performance overhead during debugging, though this can typically be mitigated when not in use.
React Native DevTools vs. Flipper: When to Use Each
Now that we understand the core functionalities and strengths of both tools, let’s explore the best use cases for each in the context of the new React Native architecture (0.81+).
Use React Native DevTools When:
- Focusing on React Components and State: If your debugging needs are primarily centered around the JavaScript layer—like inspecting components, props, state, or Redux stores—React Native DevTools provides an optimized and lightweight solution.
- Wanting a Simple Setup: If you prefer a tool that is easy to set up and doesn’t require installing third-party applications, DevTools is the better option.
- Debugging Render Performance: With the integration of React Profiler in React Native 0.81+, you can easily track component rendering behavior and performance bottlenecks in React components.
Use Flipper When:
- Debugging Native Modules or Integrations: If your app relies heavily on native code or third-party native modules, Flipper provides an advanced debugging environment for inspecting native-level logs, crashes, and performance issues.
- Wanting Real-Time Performance Monitoring: Flipper provides more comprehensive performance monitoring tools, including memory, CPU usage, and frame rate statistics, which are essential for performance optimization.
- Working on Large Projects or Complex Apps: For complex apps involving advanced interactions between JavaScript and native code, Flipper’s powerful suite of tools makes it easier to manage and debug both layers effectively.
The Ultimate Debugging Workflow: Combining React Native DevTools and Flipper
The most effective debugging workflow in the new React Native architecture doesn’t involve choosing between React Native DevTools and Flipper—it’s about using both tools together to get the full picture.
- Use React Native DevTools for Component and State Inspection: Start by using React Native DevTools to inspect the component tree, view state changes, and profile your app’s rendering behavior. This will allow you to identify inefficient renders or issues within the React layer.
- Use Flipper for Native Debugging: Once you’ve identified JavaScript issues, switch to Flipper for debugging native modules, network traffic, and other native-level performance issues.
- Leverage Flipper’s Plugins: Use Flipper’s plugins like the Redux Debugger, Crashlytics, and SQLite Viewer to get an in-depth look at your app’s logic and state management.
- Test and Profile in Parallel: While running your app in Flipper, use React Native DevTools to profile React components and compare performance before and after optimizations.
By integrating both tools into your workflow, you can ensure a smoother, faster, and more reliable debugging process for your React Native 0.81+ apps.
Conclusion: Mastering Your Debugging Workflow
As React Native 0.81+ introduces new architecture and optimizations, developers need to adjust their debugging workflows accordingly. React Native DevTools is fantastic for inspecting JavaScript components and state, while Flipper excels in native debugging, real-time performance monitoring, and advanced troubleshooting.
For the ultimate debugging workflow, combining React Native DevTools for React-specific issues with Flipper for native-level inspection provides the most comprehensive debugging experience. Embrace both tools to ensure you’re able to tackle issues across both layers of your app efficiently, ultimately leading to better app performance and a smoother development process.
Related Hashtags:
#ReactNative #DevTools #Flipper #MobileDevelopment #ReactNativeDebugging #ReactNative081 #AppDebugging #ReactNativePerformance #MobileAppDev #ReactNativeTools #DebuggingTools


